Model and integration · Task, effort and cost
MiniMax M3.1 Flash: faster and cheaper at which task?
Read effort curves, AA43 and API billing separately. The weight files and community license now add another question: what does running the whole model require?
MiniMax formally released M3.1 Flash on October 19, identifying the anonymous Space Bunny as an early version. We read the launch, independent evaluation and API documentation on October 20 Beijing time. The figures show vendor evaluations; we did not call the model, run these tasks or buy a subscription.
Start with the workflow behind “faster”
The formal model is available through the MiniMax API, M Plan and MiniMax Code as MiniMax-M3.1-Flash, with a documented 1M context window and adjustable effort. The launch claims nearly threefold online inference speed and 70% lower overall agent usage cost than its predecessor. These are vendor comparisons, not a uniform saving for every workload.
For a batch of customer documents, a model still needs tools to read files, query systems and save results. Output speed is one part; tool waits, retries and human review also take time. Compare the same material and completion criteria, then inspect how the whole task ends.
Sources and further reading
- MiniMax M3.1 Flash releaseVendor source · October 19Release access, five-setting task curve and evaluation conditions. Speed and cost improvements are vendor claims; weights follow separately.
- Current model invocation and effortOfficial documentation · read October 201M context, five effort levels, default max and endpoint configuration; we did not execute the examples.
One model, five levels of effort
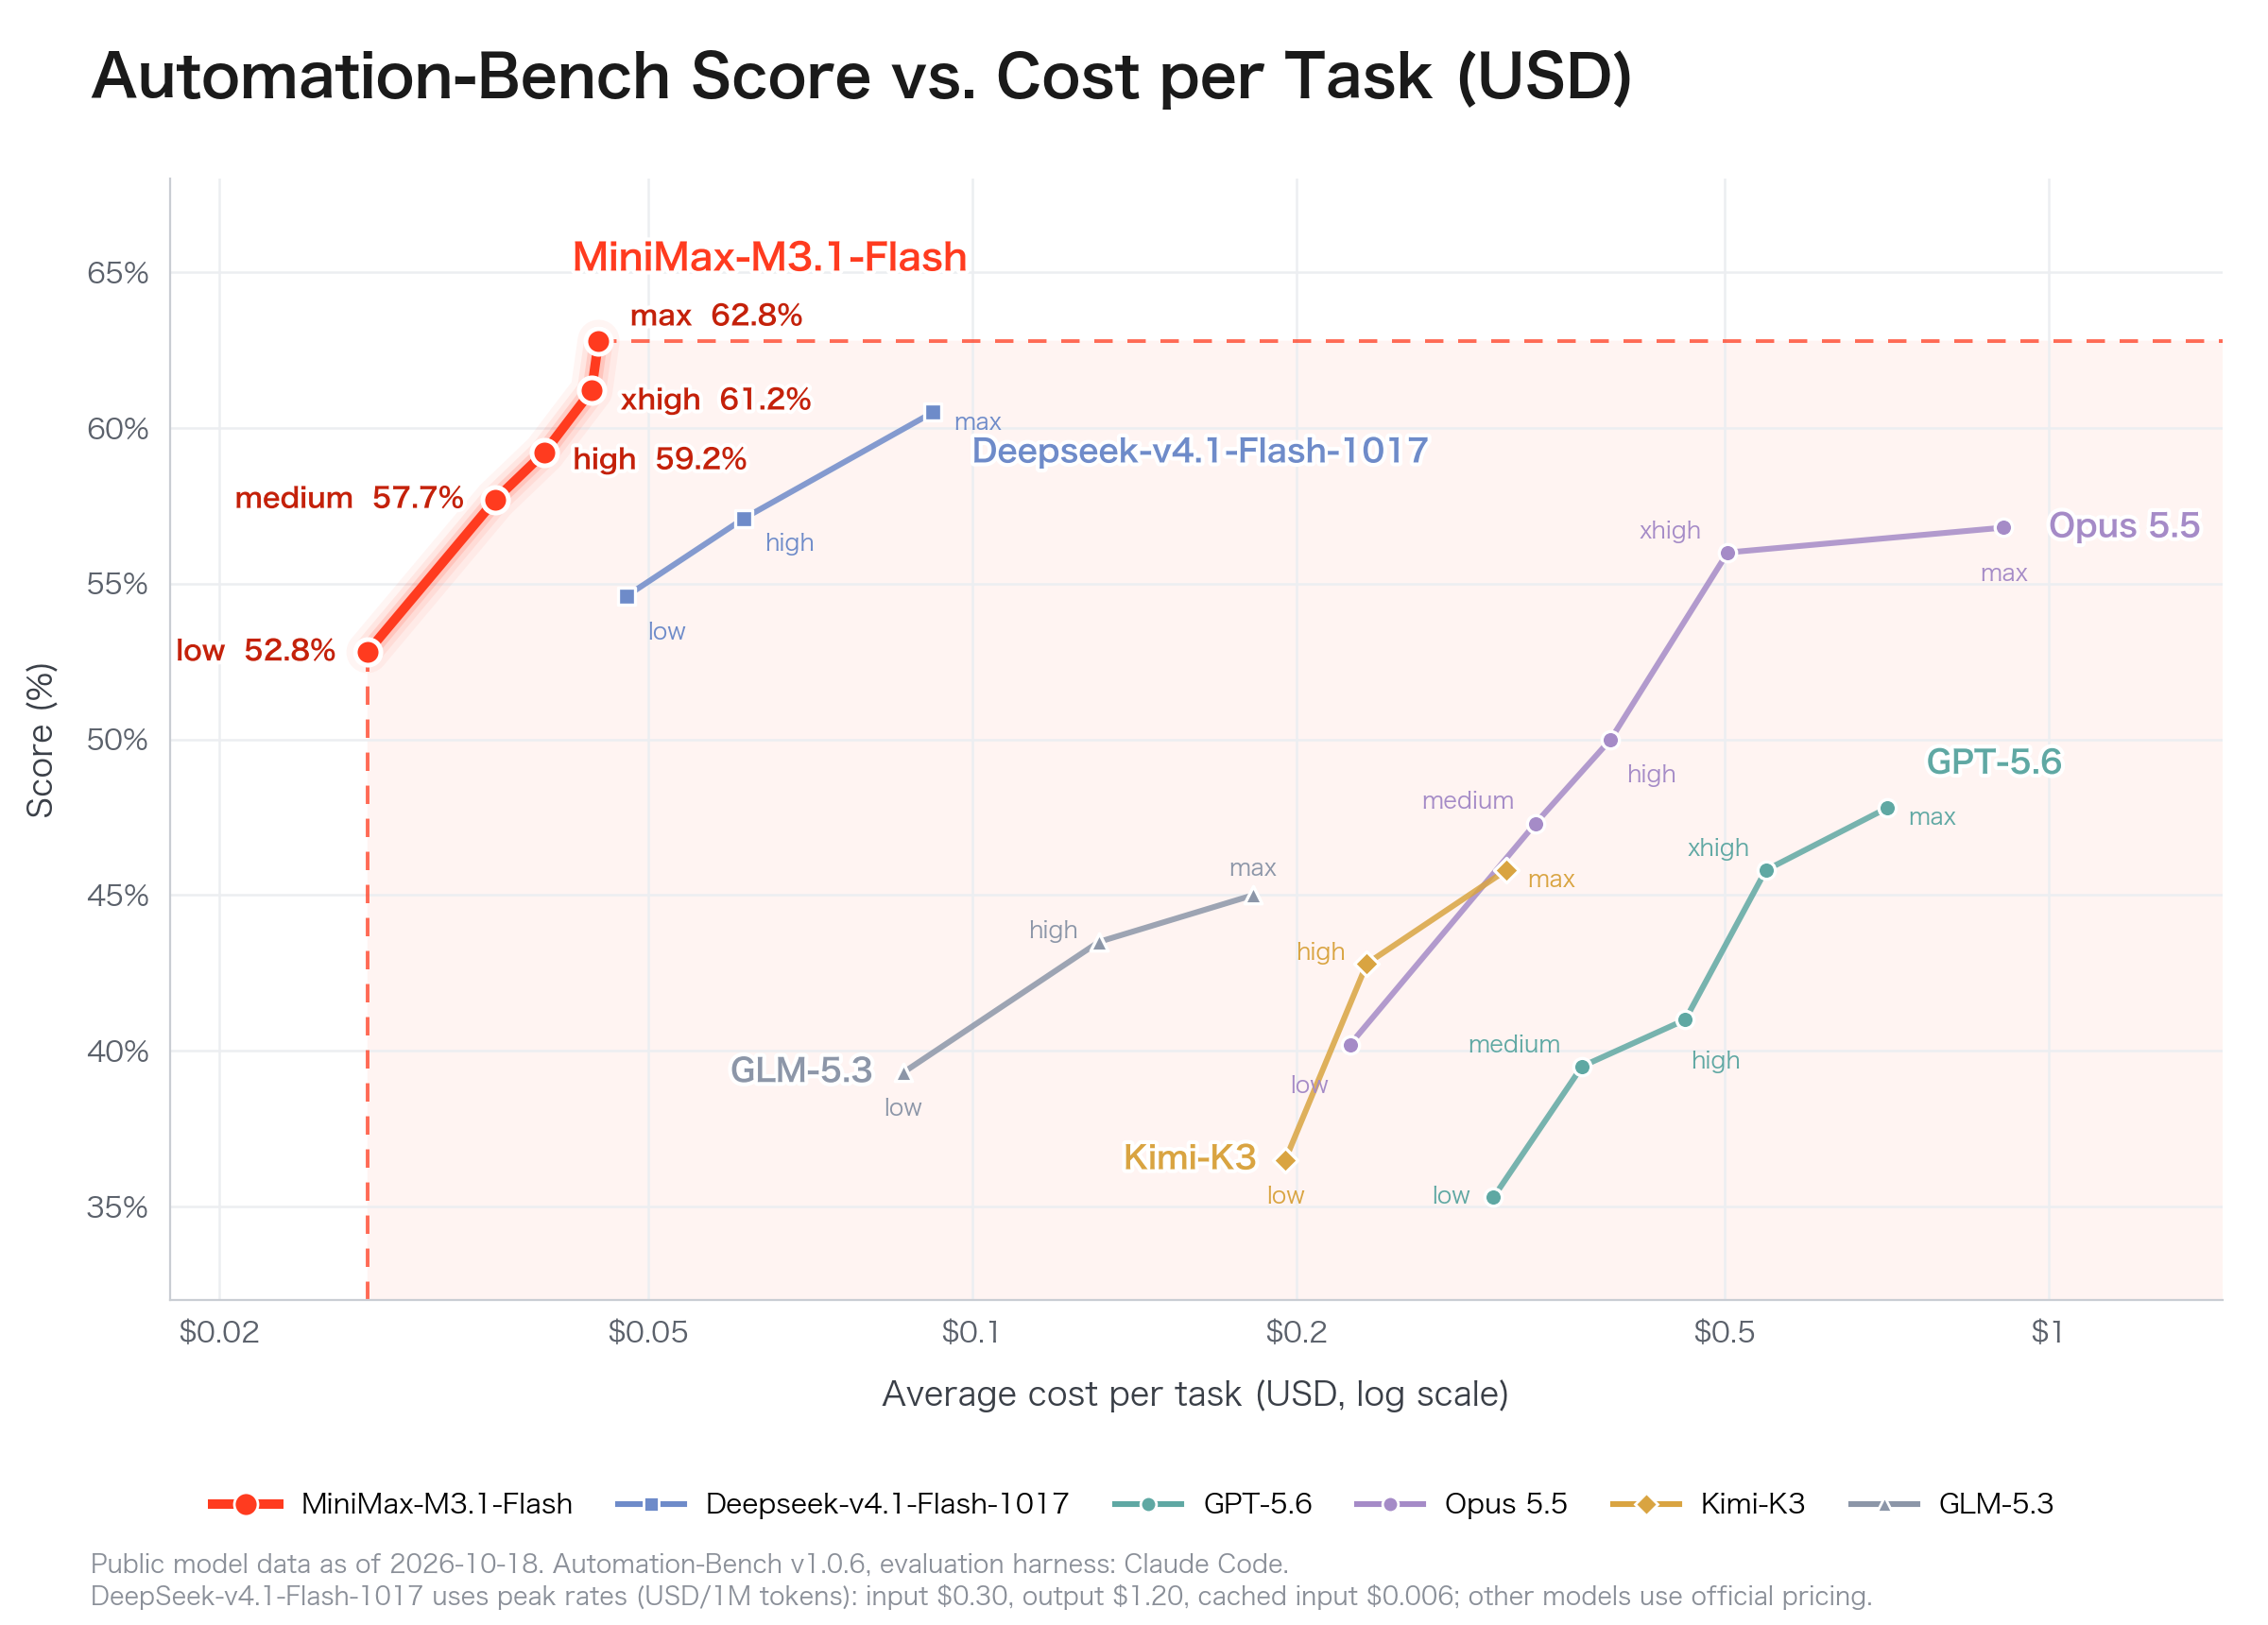
The API supports low, medium, high, xhigh and max, defaulting to max. The vendor’s within-model Automation-Bench curve shows 52.8%, 57.7%, 59.2%, 61.2% and 62.8%. Higher effort changes both results and cost; the maximum score and minimum cost are not one configuration.
The curve makes effort a concrete choice: first establish whether the task passes, then examine what extra time and cost buy. It does not establish that max is always best value or that your spreadsheet, repository or cross-app workflow has the same success rate.
Sources and further reading
- MiniMax M3.1 Flash releaseVendor source · October 19Release access, five-setting task curve and evaluation conditions. Speed and cost improvements are vendor claims; weights follow separately.
- Current model invocation and effortOfficial documentation · read October 201M context, five effort levels, default max and endpoint configuration; we did not execute the examples.
AA43 is another reference, not a perfect coding score
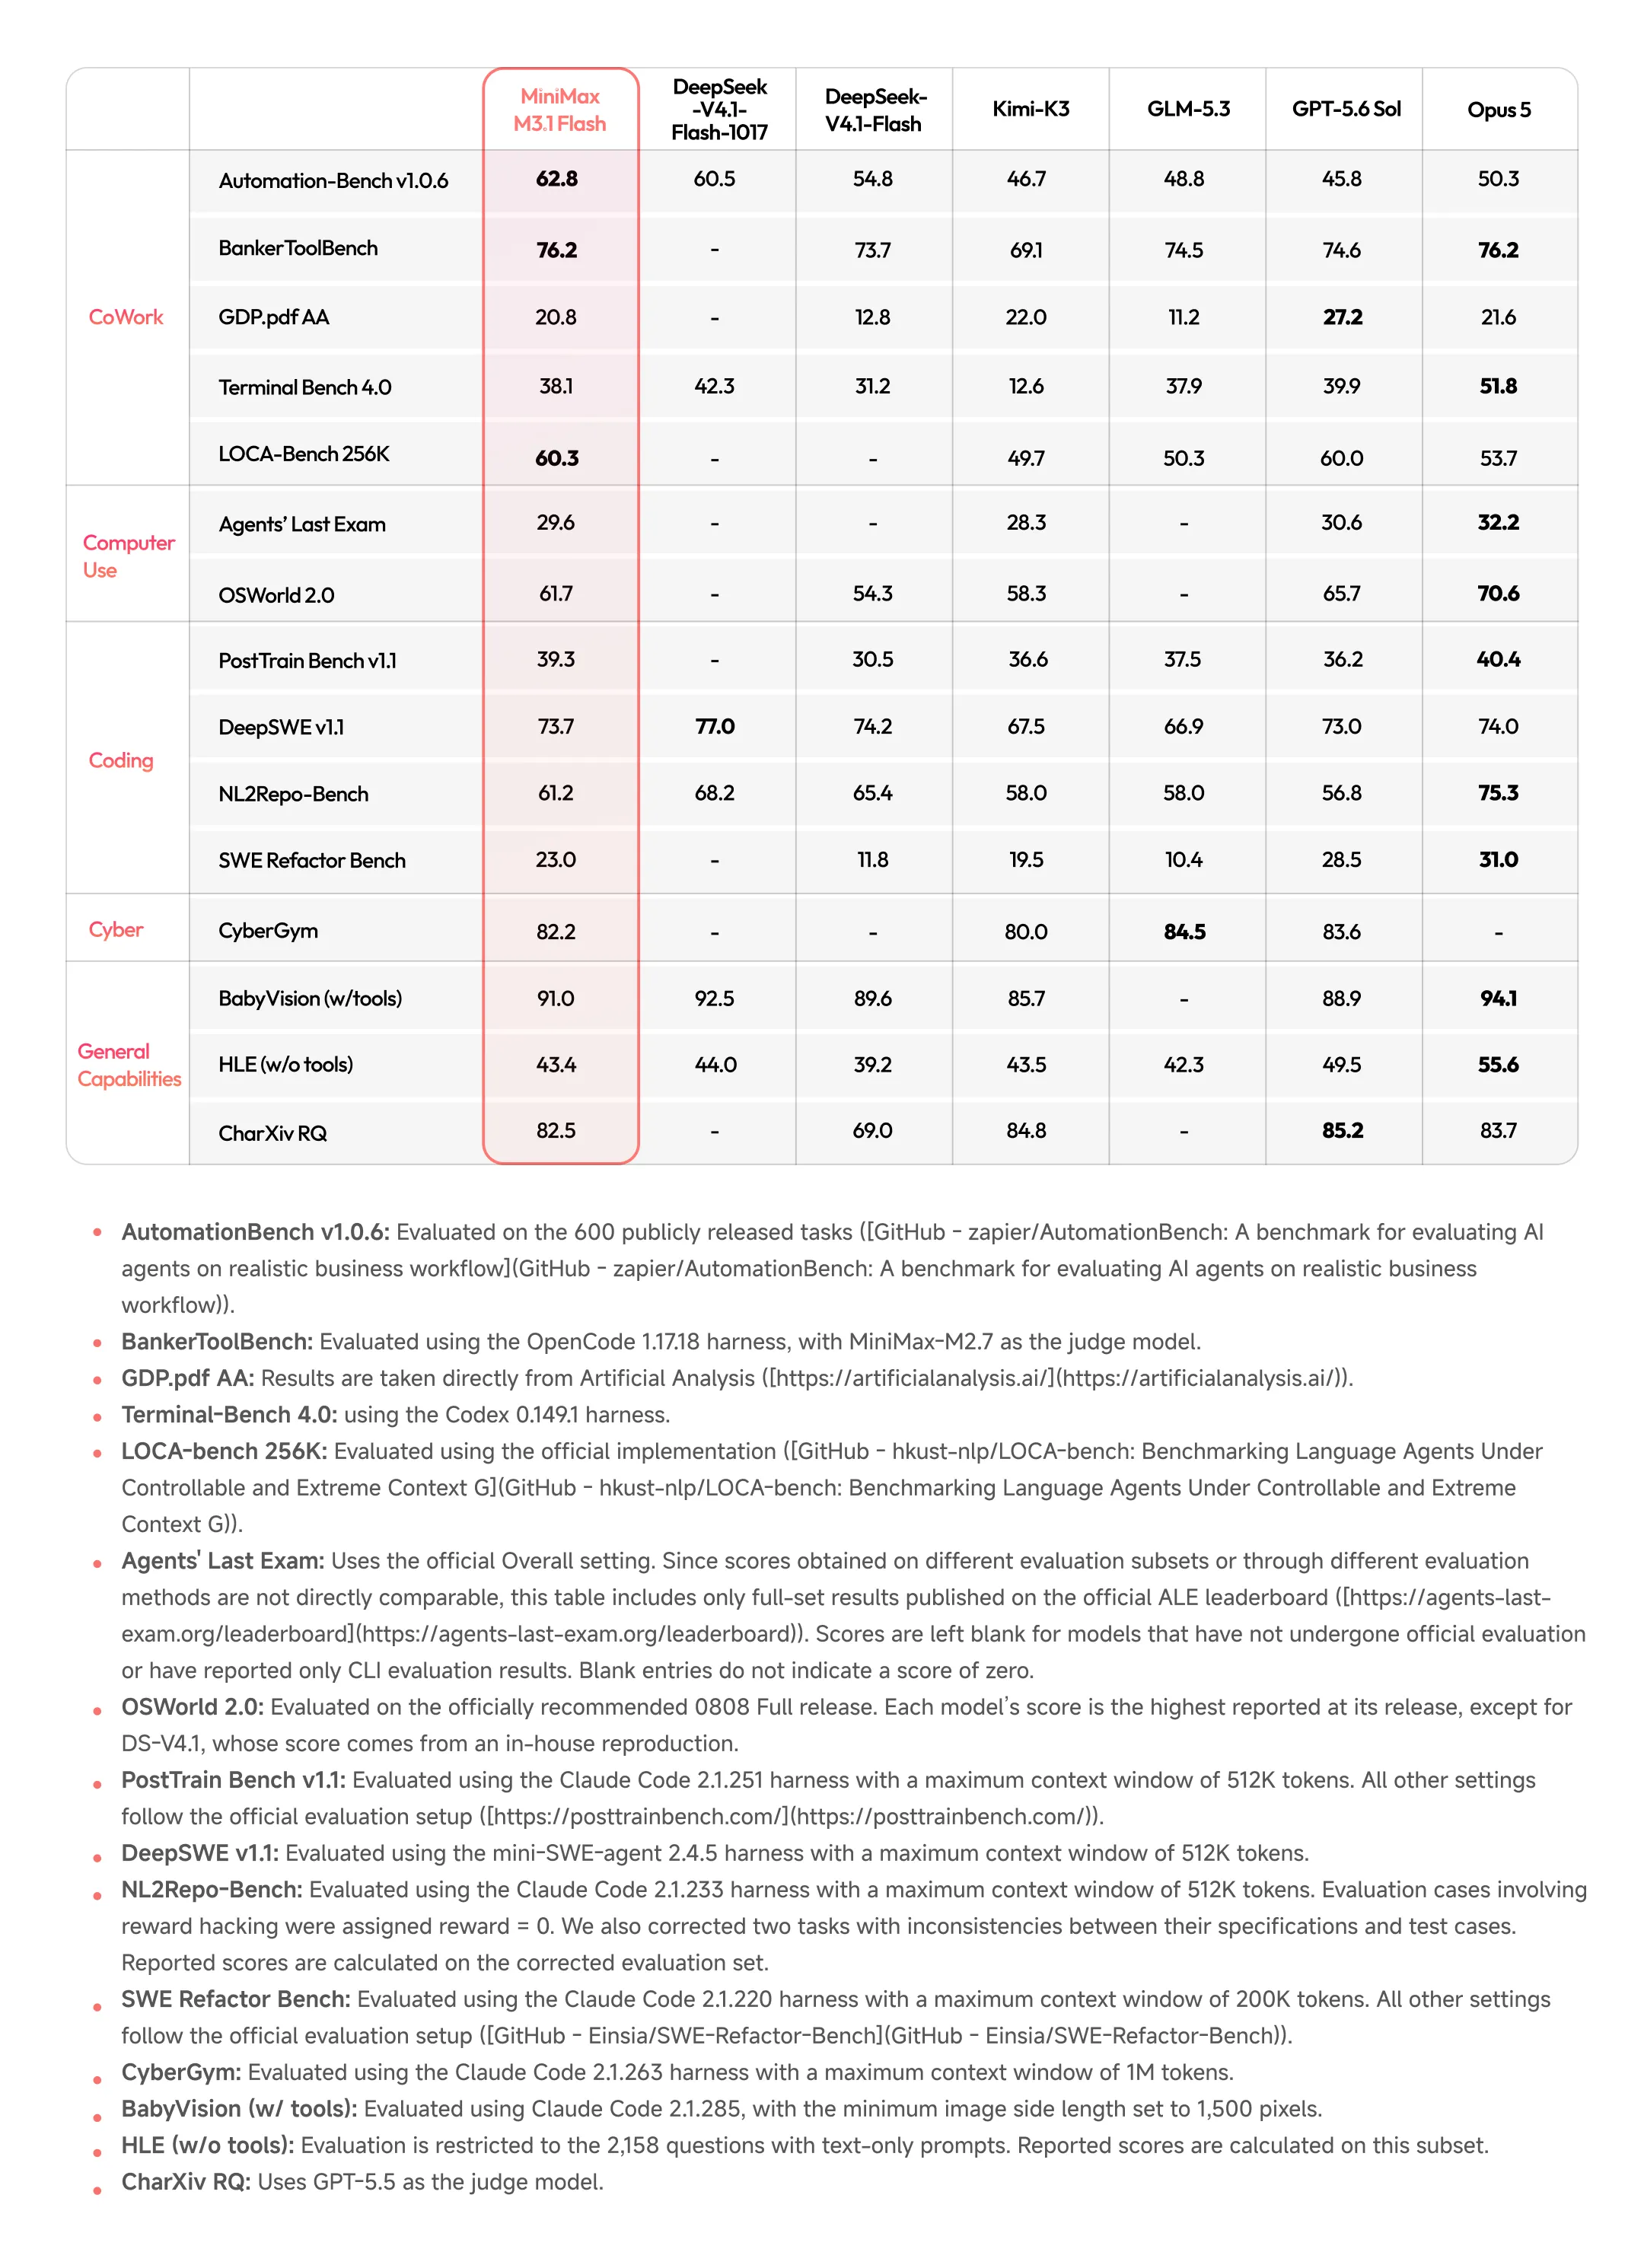
AA lists M3.1 Flash at 43 on October 20, with no effort named in its row. Haiku 5.5/max also displays 43, while DeepSeek 1017/max displays 45. These are rounded values within one aggregate index, not universal equality or a specific coding result. The current v4.3.2 suite primarily evaluates English text tasks.
Our October 20 morning AA sample lists 123 tokens/s and $0.22 average cost per index task. Speed samples can change; this is not a fixed guarantee. Speed, token rates and suite-average task cost do not determine every project bill. The current source no longer lists older DeepSeek Flash; its 39 remains in our dated October 19 comparison. No matching Pi/high result is present for M3.1 Flash, so we add no coding-board rank.
Sources and further reading
- MiniMax M3.1 Flash releaseVendor source · October 19Release access, five-setting task curve and evaluation conditions. Speed and cost improvements are vendor claims; weights follow separately.
- Current AA leaderboardIndependent table · read October 20M3.1 Flash scores 43, without an effort label in the source row; all included models were reread.
- AA Intelligence Index methodv4.3.2 · ten evaluationsPrimarily an English text index, separate from a single task suite’s pass rate.
- MiniMax’s separate AA model pageIndependent results · read October 2043, 123 tokens/s and a $0.22 suite-average task cost; not a bill for your workload.
Check the model, effort and bill together
Current international API rates per million tokens are $0.15 input, $0.60 output and $0.015 cached input. M Plan quotas and metered API billing are different arrangements. Check the account, actual model and effort; compare full usage, retries, waiting and completion. The same page lists older M3 at $0.30 input and $1.20 output for its up-to-512K input tier. Halving those token rates is a different calculation from a 70% reduction in total task cost.
The launch page read October 20 placed downloadable weights and Pro in future plans. The October 24 chapter below follows the actual files and conditions; it does not backdate weight availability to October 19 or establish Pro access. Existing API and MiniMax Code routes remain separate options.
| Item | Price | What to keep |
|---|---|---|
| Uncached input | $0.15 | Actual input usage |
| Output | $0.60 | Full billed usage and retries |
| Cached input | $0.015 | Actual cache usage |
Sources and further reading
- MiniMax M3.1 Flash releaseVendor source · October 19Release access, five-setting task curve and evaluation conditions. Speed and cost improvements are vendor claims; weights follow separately.
- Current model invocation and effortOfficial documentation · read October 201M context, five effort levels, default max and endpoint configuration; we did not execute the examples.
- Current API pricing and subscription boundaryOfficial pricingInput, output and cache reads are priced separately; M Plan and metered API usage are distinct.
Weights are listed: 23B active does not make this a 23B deployment
The official Hugging Face repository now lists the card, configuration, license and weight shards, changing the earlier pending status. Our October 24 check pins revision 54e4e69d: metadata lists 48 main shards totaling about 250.1GB, plus a separate 2.3GB DSpark file. We inspected the manifest rather than downloading the weights or running local inference.
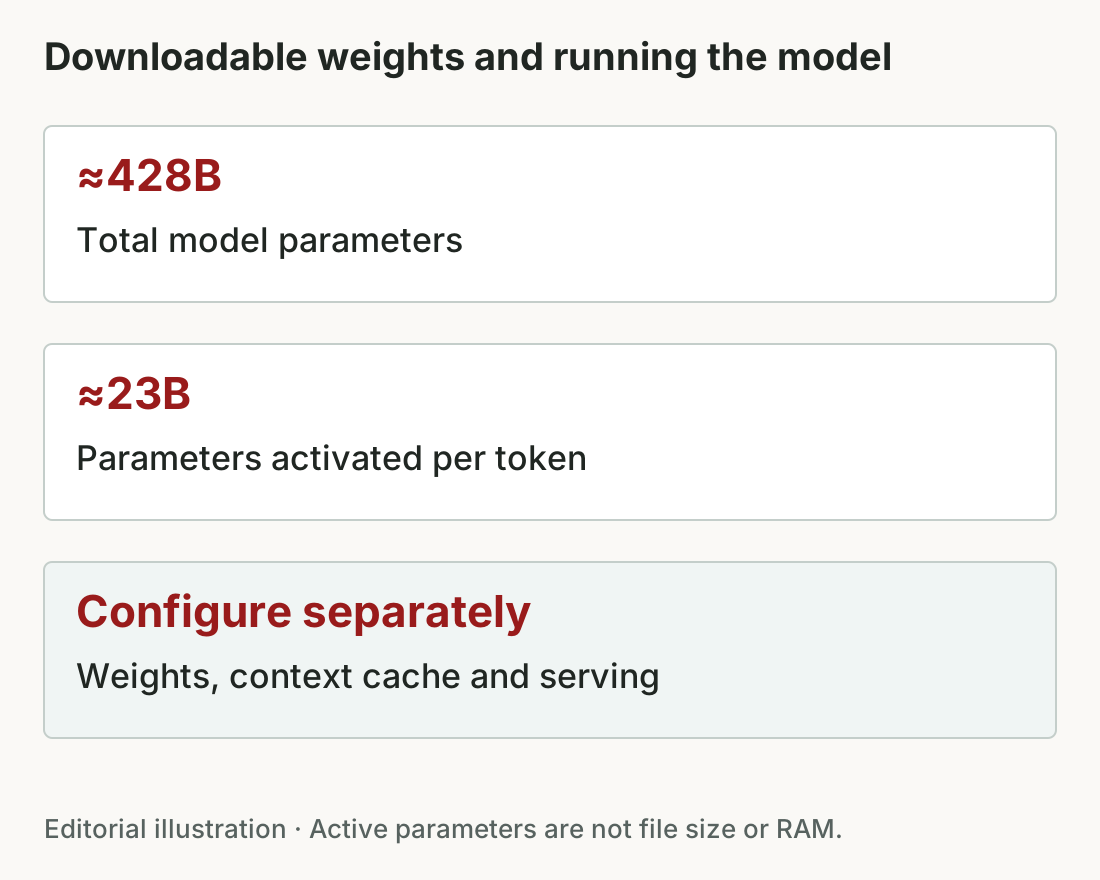
The card describes about 428B total parameters and 23B activated per token, with text, image and video input and text output. Activating fewer parameters does not remove the need to store the others. File size is not a serving-memory guarantee: context caches, vision processing, draft models and the serving stack matter. The 1M context limit is configuration-dependent in practical use.
The linked vLLM recipe uses multi-GPU configurations: TP4 on Blackwell or AMD MI355X, and a full TP8 node with the corresponding FP8 path on H100/H200. Hardware-specific kernels also matter. This is an infrastructure recipe, not an ordinary-computer demonstration. Hosted API token rates do not price self-hosting; hardware, waiting, concurrency, maintenance and completion need their own accounting. No throughput or cost replication was run here.
The files use the MiniMax Community License, not MIT. Its commercial conditions include specified attribution and a one-time notice for relevant products or services at or below US$20 million in annual revenue; above that threshold, prior written authorization is required. Other conditions still apply. This summarizes the text: read the full license before adopting it. Downloadable weights do not establish unrestricted commercial use.
The practical change is another route: existing APIs and tools remain options, while adequately resourced teams can investigate self-hosting. First decide whether the goal is trying a capability, changing where data travels, or controlling the service. Those goals require different comparisons. Open weights, execution location and data routes remain distinct questions.
- Inspect the fixed model card and files
- Read the full community license
- Continue with execution location and data routes
Sources and further reading
- Fixed model cardPrimary material · checked October 24Total/active parameters, inputs and inference conditions; not our run.
- Full MiniMax community licensePrimary material · checked October 24Check attribution, notice, authorization threshold and other limits in the full terms.
- Original vLLM deployment recipePrimary material · checked October 24TP4/TP8 and hardware paths are recipes, not our matched throughput test.
- Fixed repository file-index entryPrimary material · checked October 24Main shards and DSpark checked in repository metadata; no large weights downloaded.