A concrete result · Scientific data becomes a teaching map
A complete ultraviolet sky map: observation and prediction
Follow the full-sky image and four build stages to see how Claude Science helped organize old observations and fill gaps—and why a complete map still needs provenance.
Anthropic published the creator’s account on October 8; the technical page dates the map September 16. We inspect the original images, method and current entry without rebuilding the map or using the creator’s account.

Start with a map for teaching the sky
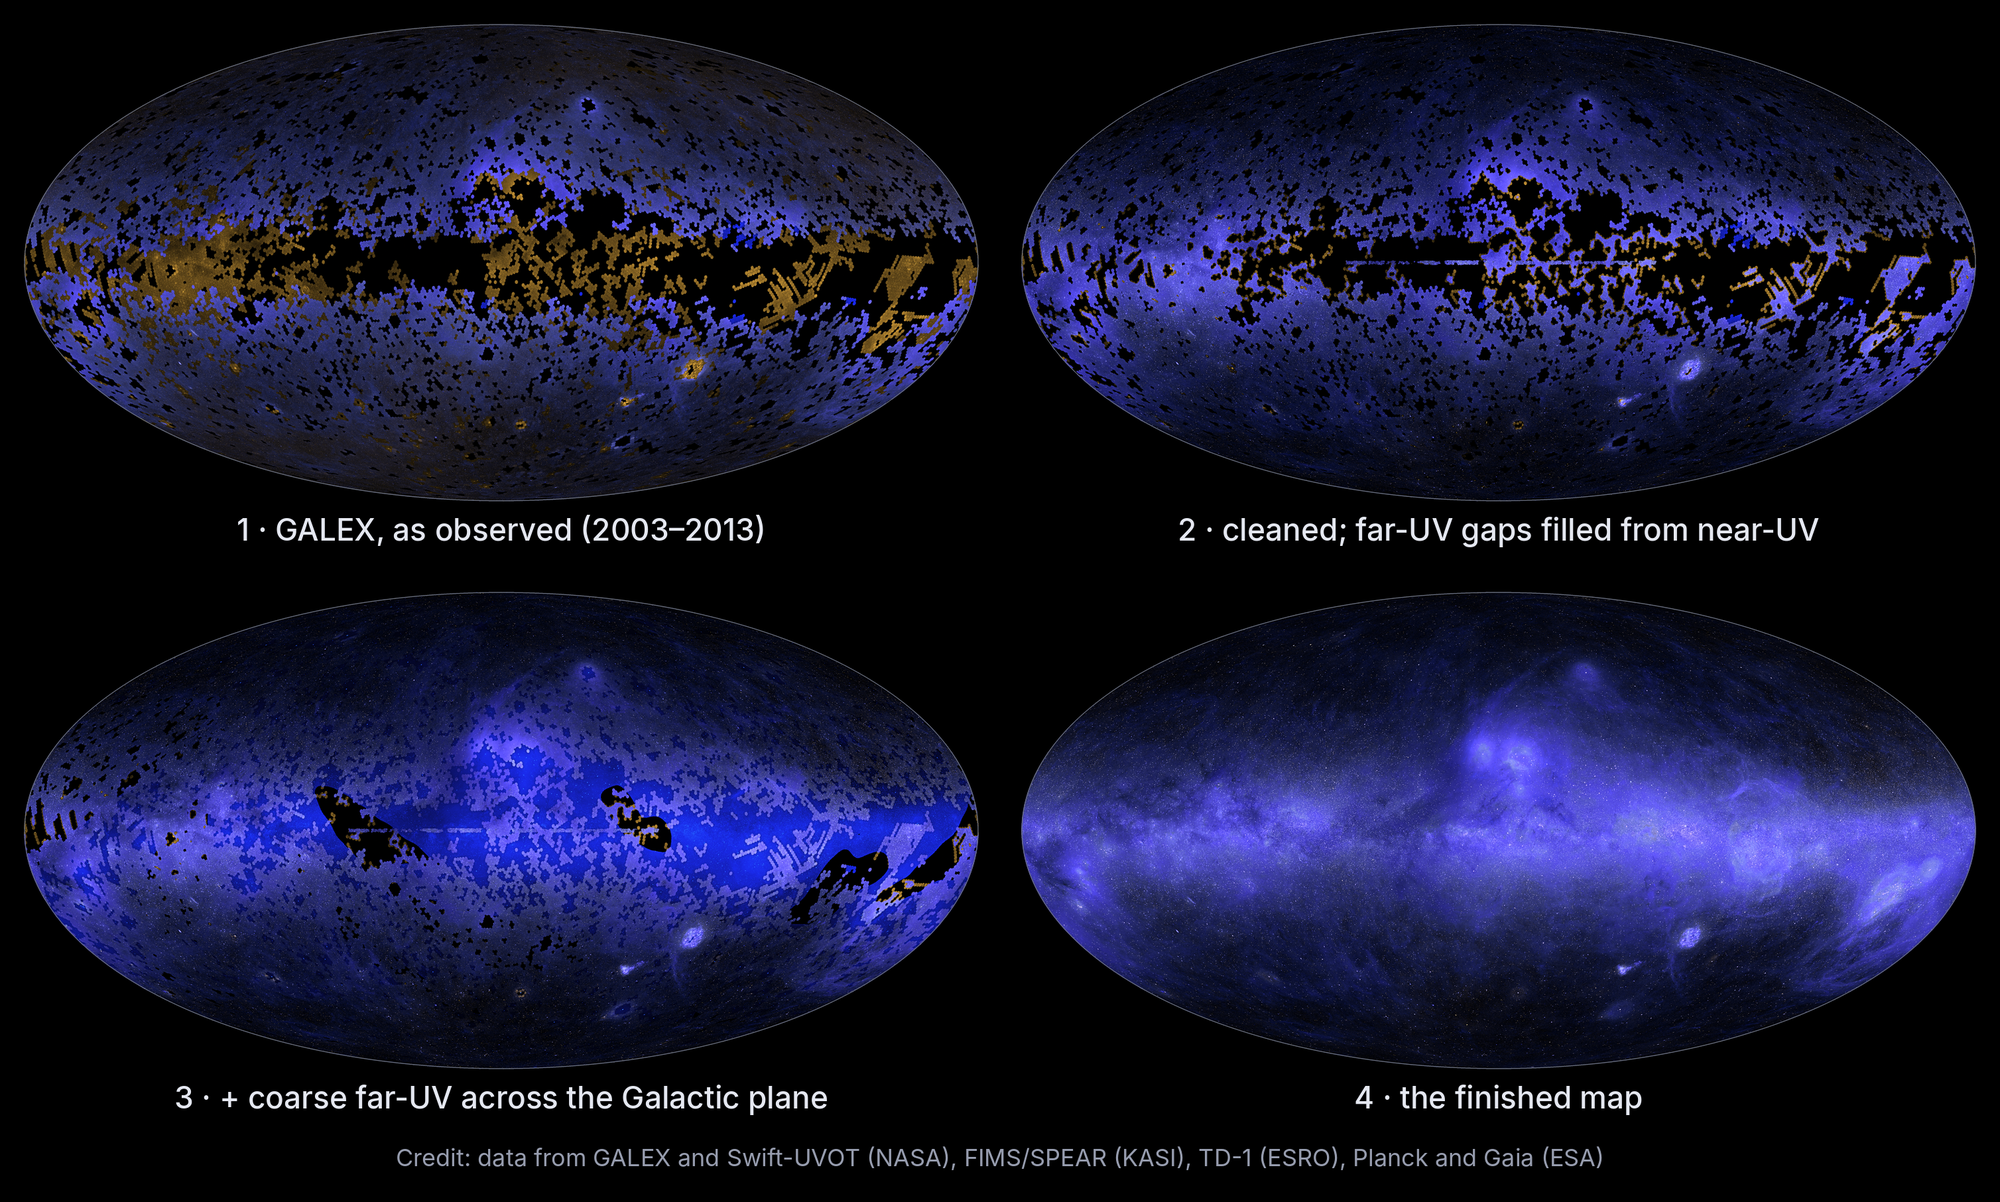
This oval map places the Galactic Centre in the middle. Ultraviolet reveals hot stars and dust illuminated by starlight, letting students explore familiar sky in another band. Astrophysicist Brice Ménard used Claude Science to complete a teaching resource he had long put aside.
The map is complete, but its support varies across the sky. Telescope observations and statistical predictions meet in one image; provenance determines what a region can help you understand.
Sources and further reading
- Brice Ménard: the missing map of the skyCreator’s account · Anthropic · October 8The goal, agent-assisted survey processing and a correction after human inspection. The author works at both Johns Hopkins and Anthropic.
- The creator’s map, method and provenance exampleCreator’s technical page · checked October 10The 28% / 27% prediction scope, regression, provenance and use boundaries; download links are still forthcoming.
How the black gaps become a connected sky
GALEX gathered about 38,000 observations in 2003–2013, avoiding some bright stars and the Galactic plane to protect its detectors. Building the map required background cleaning, brightness calibration and common coordinates and resolution. The four stages make that work visible.
Gap filling uses statistical regression learned from existing dust, starlight and other data. Claude Science helped organize agents, processing and computation; the regression predicts ultraviolet brightness. The account does not identify a particular Claude model version.
Sources and further reading
- Brice Ménard: the missing map of the skyCreator’s account · Anthropic · October 8The goal, agent-assisted survey processing and a correction after human inspection. The author works at both Johns Hopkins and Anthropic.
- The creator’s map, method and provenance exampleCreator’s technical page · checked October 10The 28% / 27% prediction scope, regression, provenance and use boundaries; download links are still forthcoming.
- Full-sky ultraviolet maps: technical manuscriptCreator’s draft · October 2026 · in preparationPixel classes, spatial hold-out validation and Section 6’s lack of a blind test; not a completed peer-reviewed paper.
Complete coverage still needs provenance
The creator reports predicted finer structure over about 28% of the far-UV sky and 27% of the near-UV. Most of that far-UV region also has coarse FIMS/SPEAR constraints. A continuous image alone cannot distinguish direct imaging, cross-band inference, coarse constraints and prediction.
A local provenance example marks GALEX observations in blue and model-filled gaps in purple and red. The page explains per-pixel source weights. The overall structure supports teaching; predicted regions support neither new-star discovery nor an independent dust measurement.
Sources and further reading
- The creator’s map, method and provenance exampleCreator’s technical page · checked October 10The 28% / 27% prediction scope, regression, provenance and use boundaries; download links are still forthcoming.
- Full-sky ultraviolet maps: technical manuscriptCreator’s draft · October 2026 · in preparationPixel classes, spatial hold-out validation and Section 6’s lack of a blind test; not a completed peer-reviewed paper.
Hide observations to test the gap filling
The creator held out GALEX regions, predicted their ultraviolet values without seeing them, then compared with the observations. That tests gap filling in similar regions; it does not turn unobserved sky into new measurements.
For the gap-fill predictor, Section 6 says validation material informed development and parameter tuning, so there is no independent blind test. The October 2026 manuscript remains a draft in preparation, without human peer review. The visible map and method do not establish independently verified all-sky accuracy.
Sources and further reading
- The creator’s map, method and provenance exampleCreator’s technical page · checked October 10The 28% / 27% prediction scope, regression, provenance and use boundaries; download links are still forthcoming.
- Full-sky ultraviolet maps: technical manuscriptCreator’s draft · October 2026 · in preparationPixel classes, spatial hold-out validation and Section 6’s lack of a blind test; not a completed peer-reviewed paper.
A person spotted discs after two agent reviews
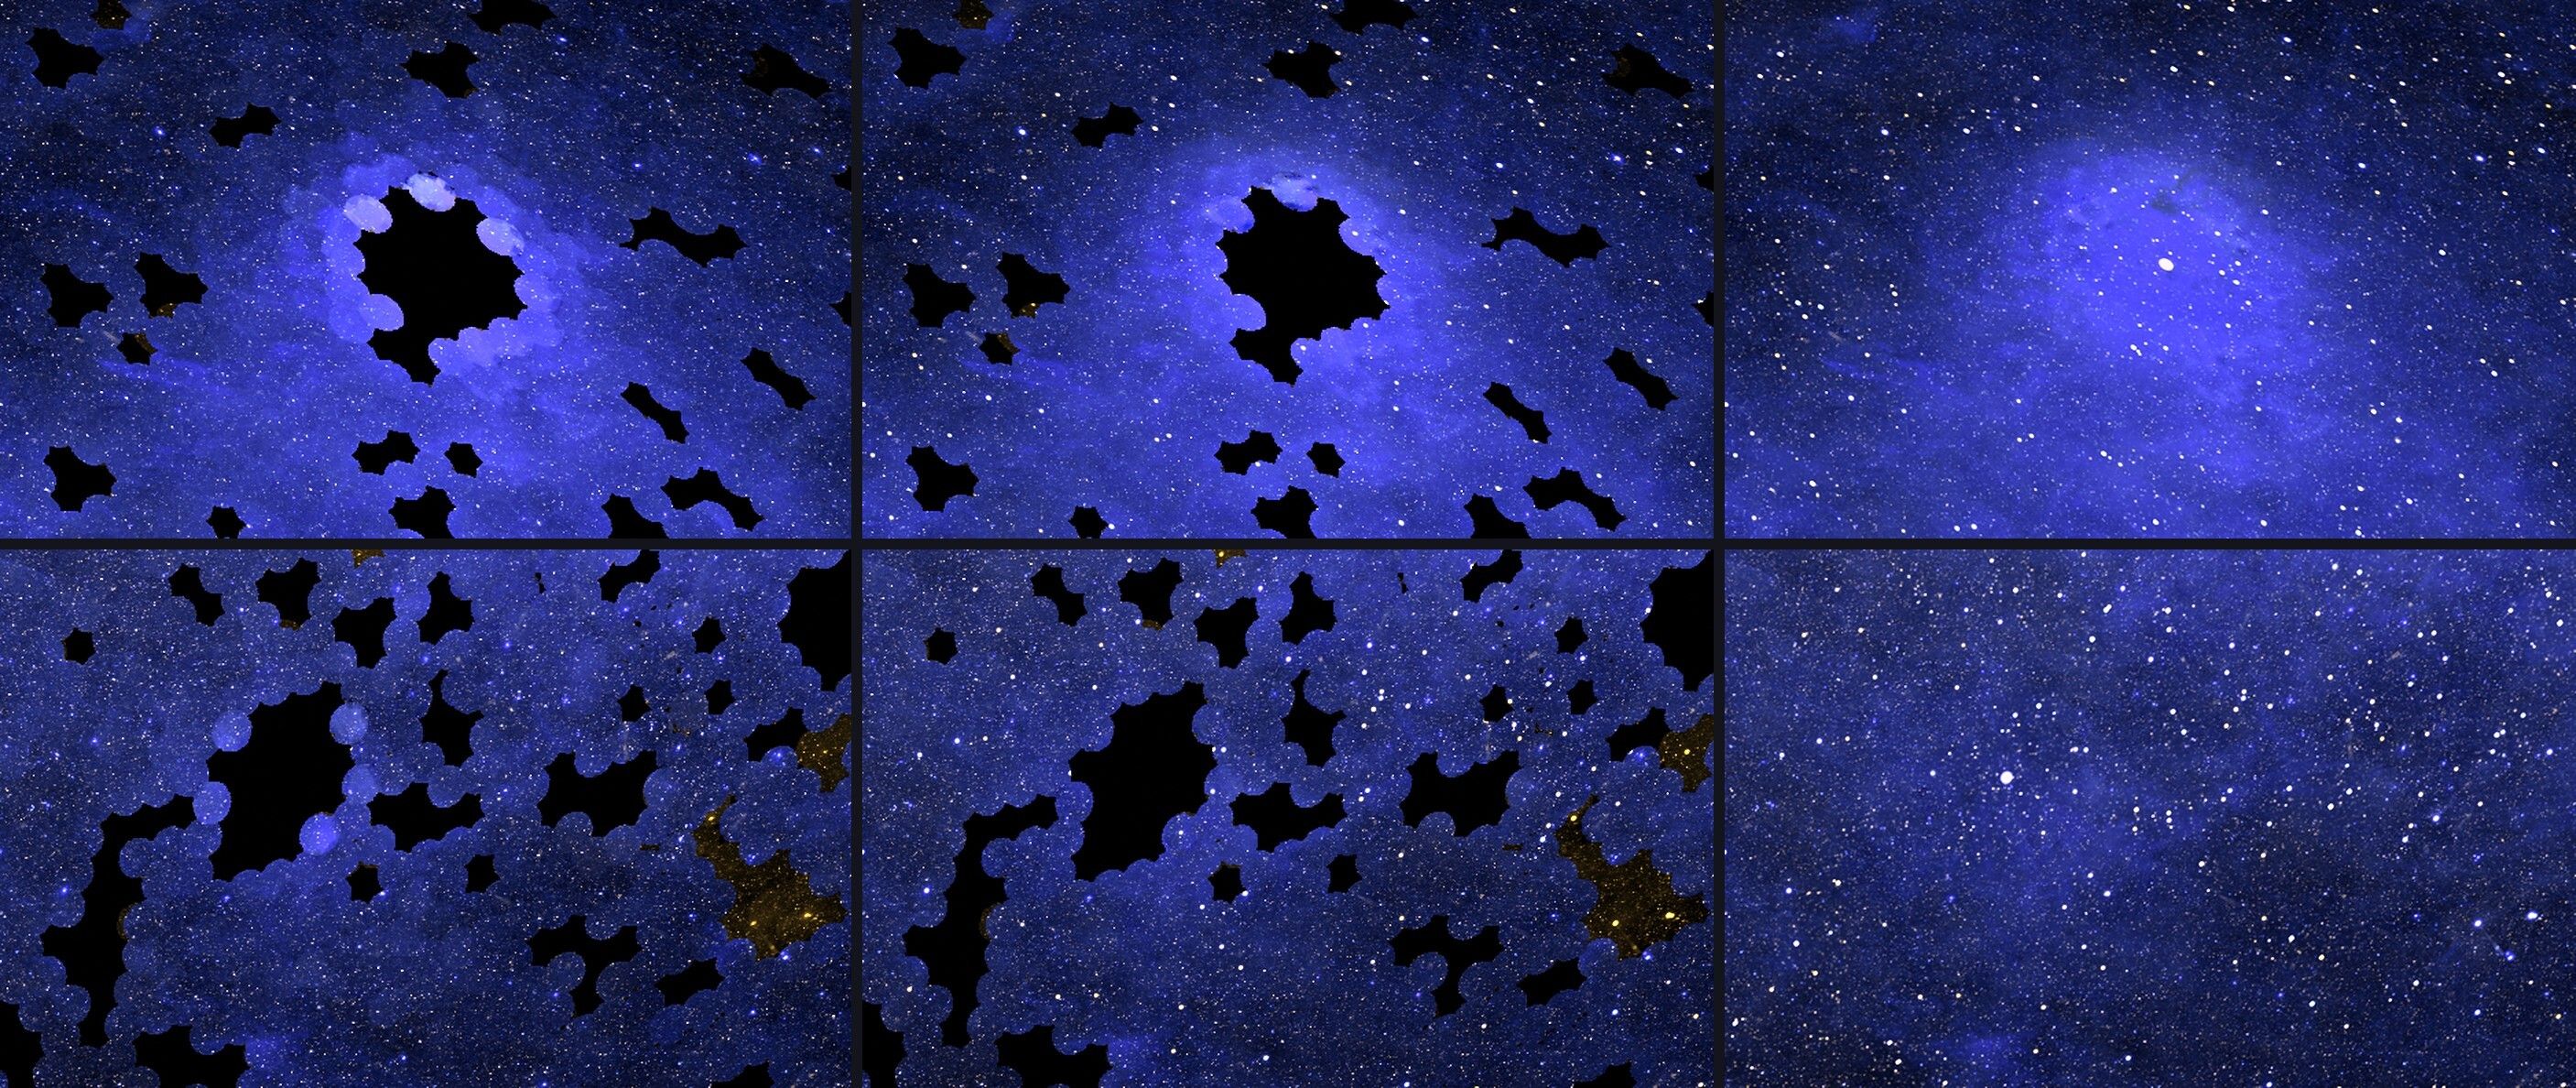
Ménard spotted faint discs in a dim field: backgrounds from individual GALEX pointings had not been fully removed. The issue was listed as a risk, yet survived two agent reviews. His observation sent the agents back to recalibrate about 38,000 pointings.
The same-contrast panels show a local improvement. The technical page still notes possible faint residual discs. The useful loop is visible: painstaking processing becomes an inspectable result, and a person finds what needs another correction.
Sources and further reading
- Brice Ménard: the missing map of the skyCreator’s account · Anthropic · October 8The goal, agent-assisted survey processing and a correction after human inspection. The author works at both Johns Hopkins and Anthropic.
- The creator’s map, method and provenance exampleCreator’s technical page · checked October 10The 28% / 27% prediction scope, regression, provenance and use boundaries; download links are still forthcoming.
Explore the map before choosing a workbench
For a curious reader, start by comparing the sky across bands. The page says FITS, HiPS and documentation downloads will be added. Its provenance and uncertainty descriptions do not establish a full-map layer switch or complete data downloads today.
For your own scientific data and computations, explore Claude Science. Its current FAQ describes a beta workbench using your plan’s Claude models, on macOS, Windows and Linux for Pro, Max, Team and Enterprise; organization plans need admin enablement. We have not rebuilt this map.
Sources and further reading
- The creator’s map, method and provenance exampleCreator’s technical page · checked October 10The 28% / 27% prediction scope, regression, provenance and use boundaries; download links are still forthcoming.
- Claude Science: current entry and FAQOfficial product guidance · checked October 10The workbench/model distinction, supported systems, plans and organization enablement.