GitHub weekly Trending and official repository · First found 2026-08-22
diagram-design: help a coding assistant choose the right diagram
Start with the relationship, process or timeline to explain. diagram-design organizes diagram choices into a reusable workflow.
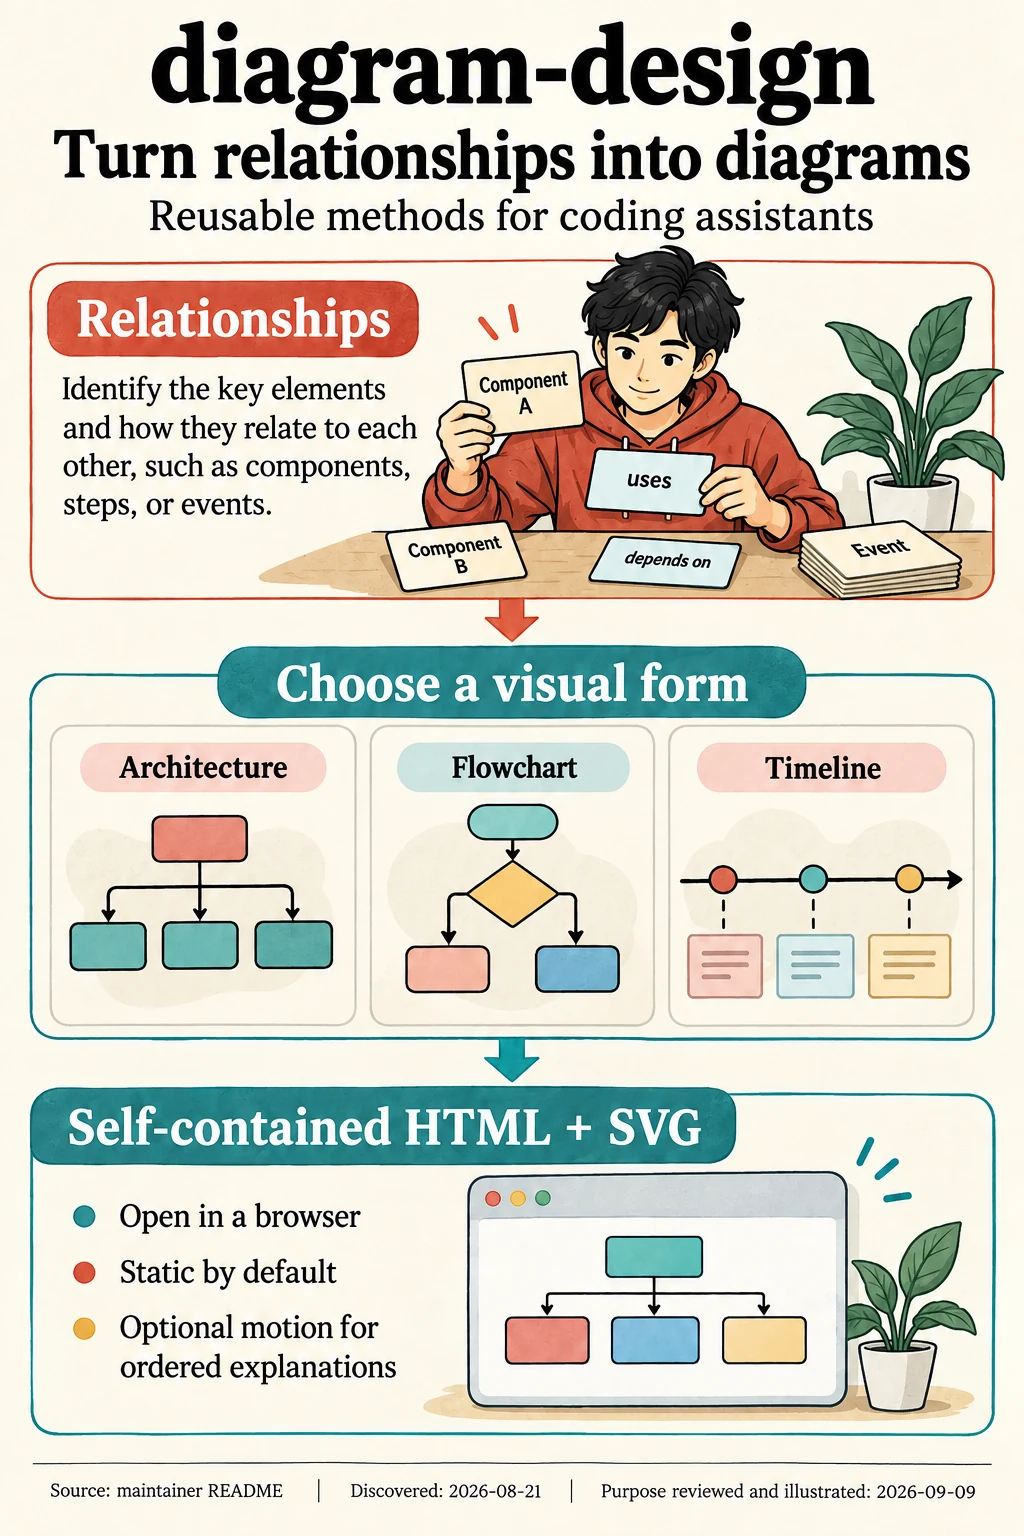
Choose a diagram for the relationship
diagram-design provides reusable diagram methods for coding assistants, including architecture views, flowcharts and timelines. Each form helps express a different relationship or sequence.
Deliver browser-readable explanations
The outputs are self-contained HTML and SVG files that open in a browser. Static output is the default, with optional animation for some ordered explanations. This describes the purpose reviewed on September 9, 2026.
Sources and notes
sources中文
Sources and notes
- Read the originalGitHub weekly Trending and official repository
Retained summary and context
Trending is a dynamic attention chart, not a stable ranking. Star growth does not prove sustained use, code quality, or commercial value.
Sources and evidence · 1 link
Each link has a purpose and scope. Link counts do not establish independent confirmation; direct support applies only to the statements specified below.
Source timeline
- · The official repository was created under MIT.
- · Ranked first on GitHub weekly Trending, which recorded 11,325 stars for the week.
- · The official GitHub API recorded 24,966 stars and 1,522 forks. A one-star change across 160 seconds is retained only as a counter check, not a growth claim.
Collection record
First discovered:
Collection and source publication have distinct dates.